Item
Arizona Department of Health Services County-Specific Data through 04/06/2021


Title (Dublin Core)
Arizona Department of Health Services County-Specific Data through 04/06/2021
Description (Dublin Core)
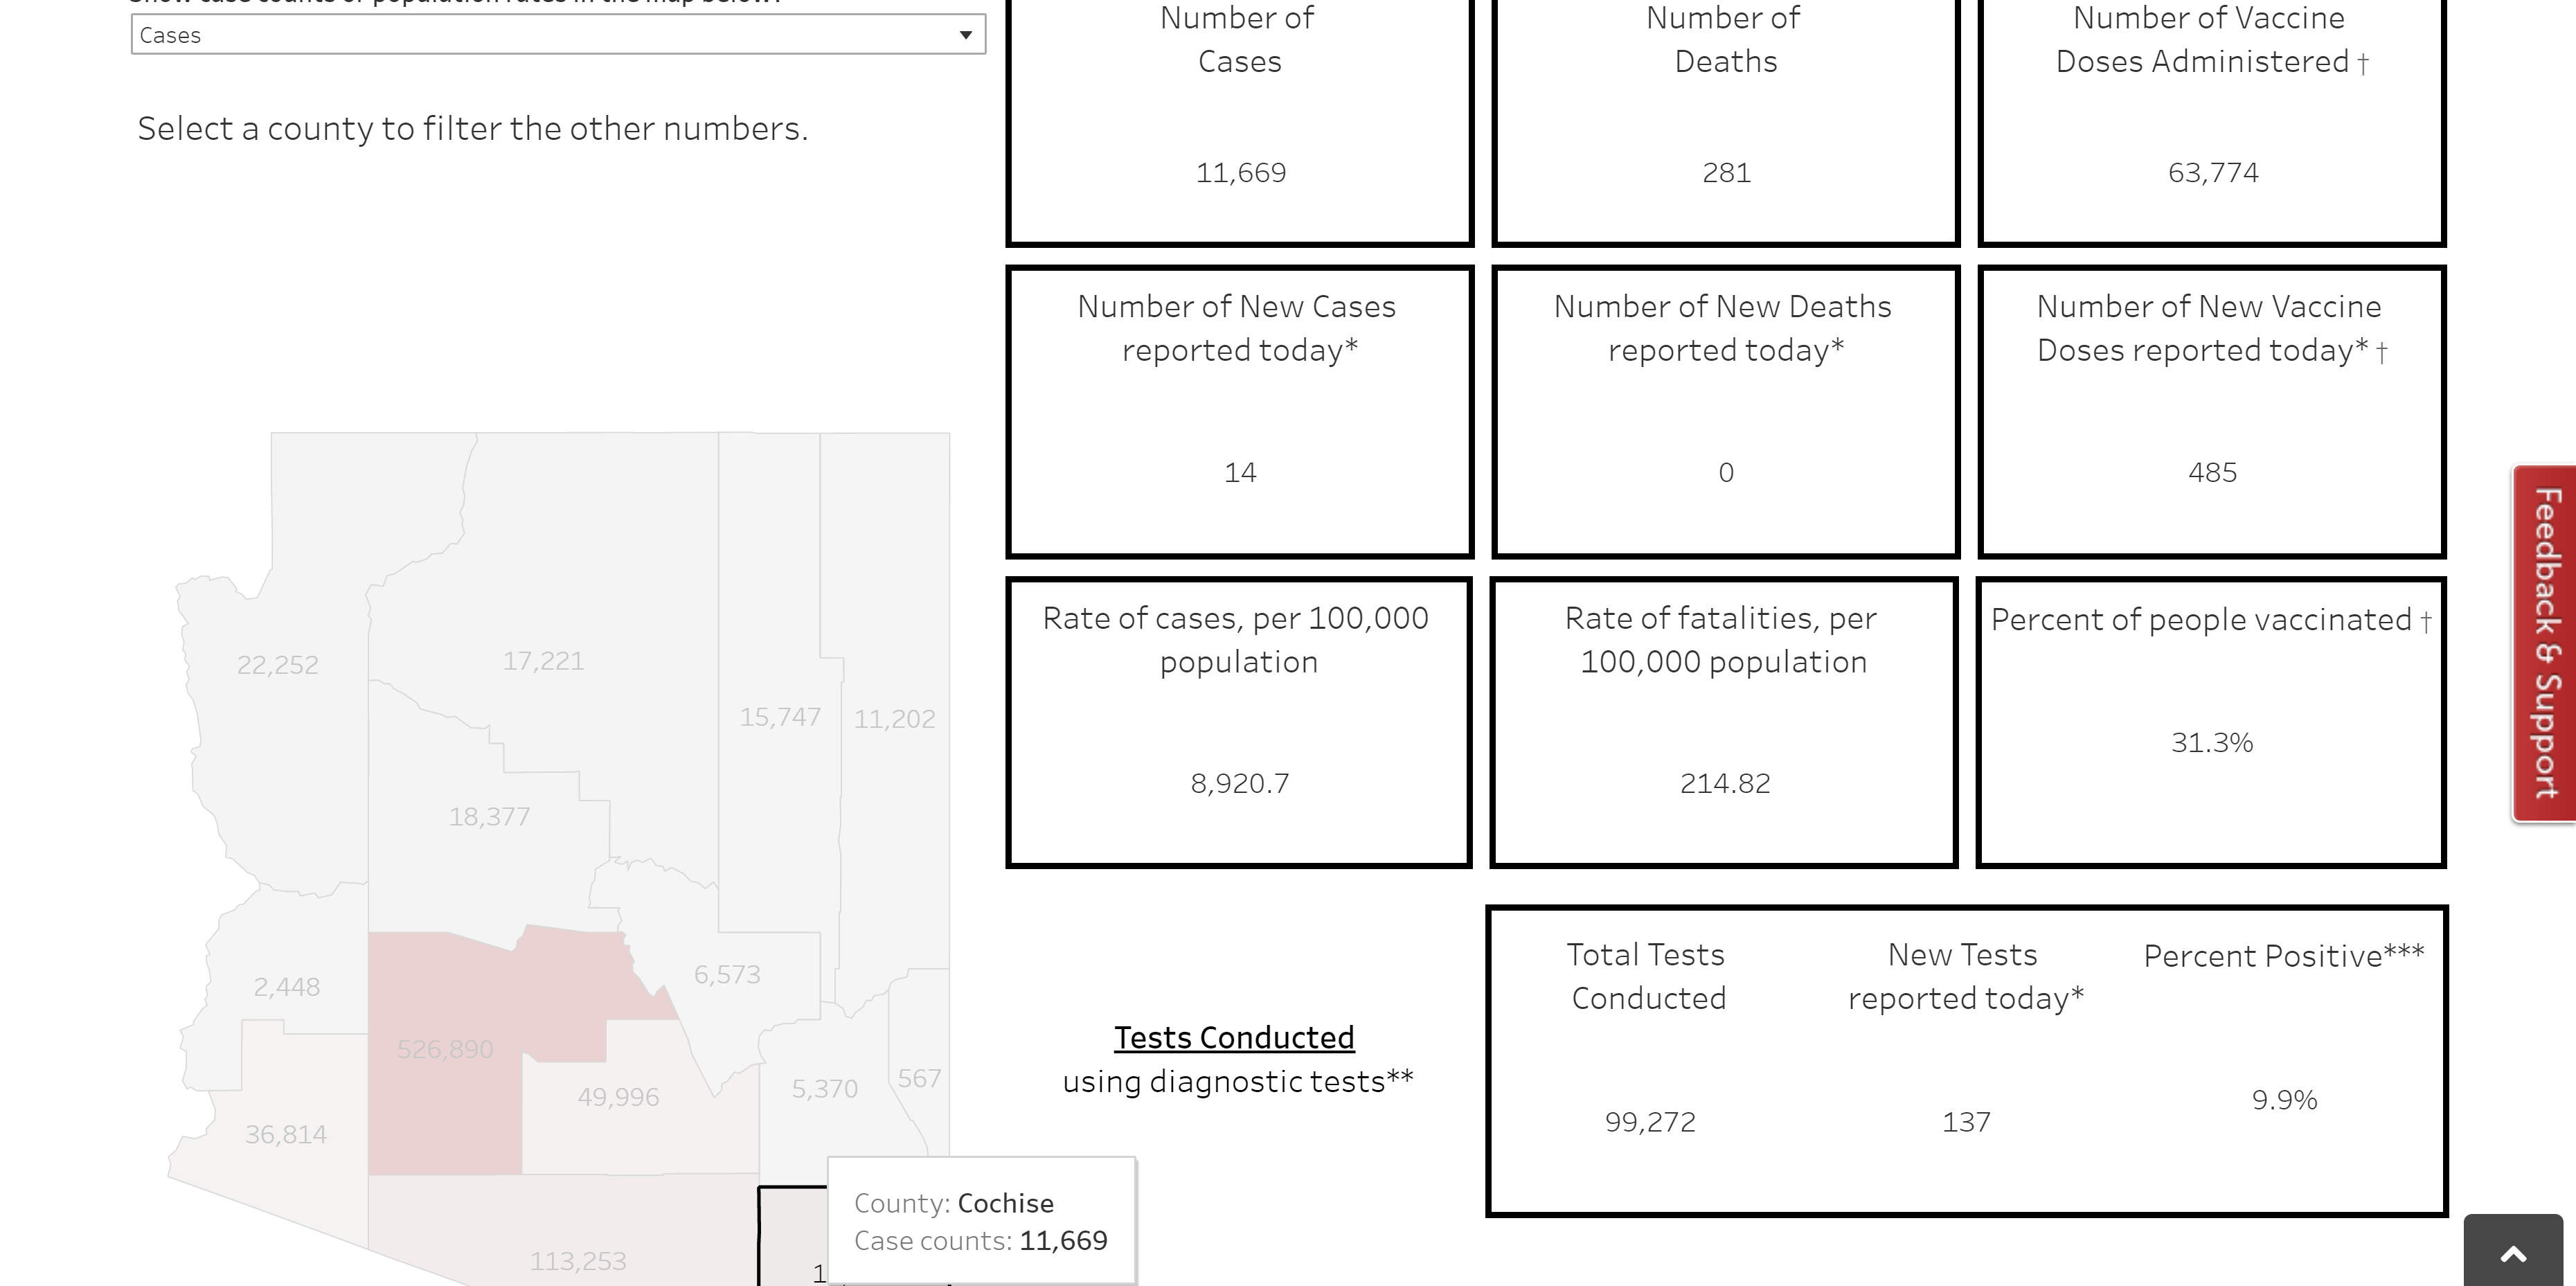
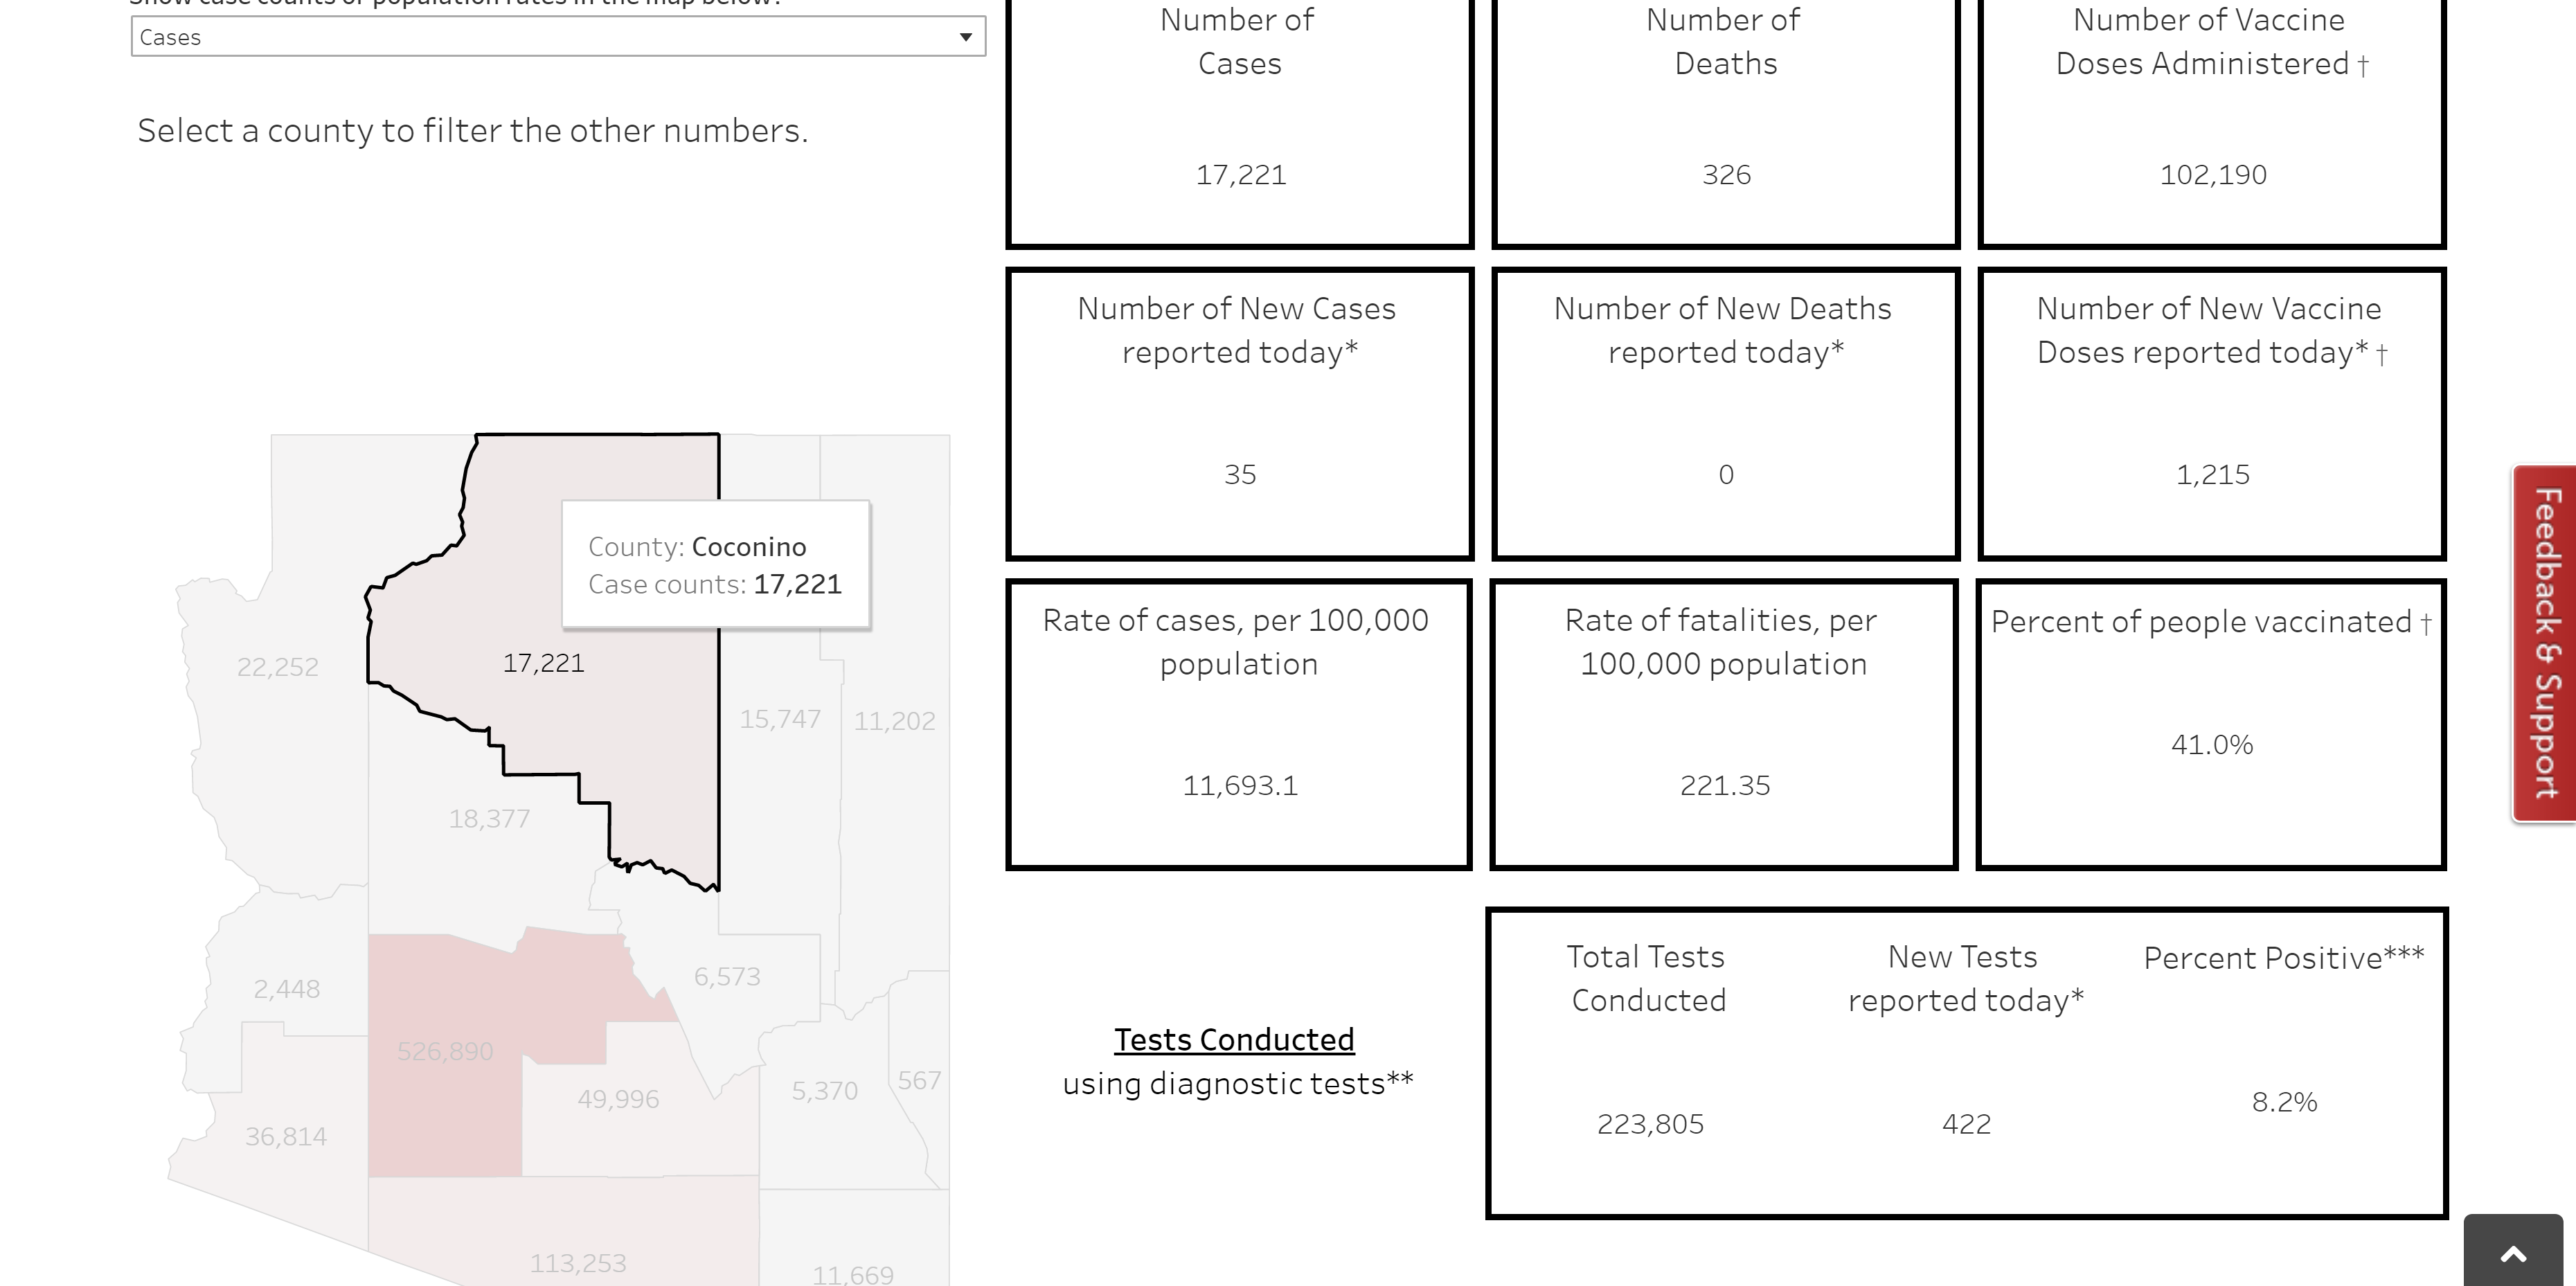
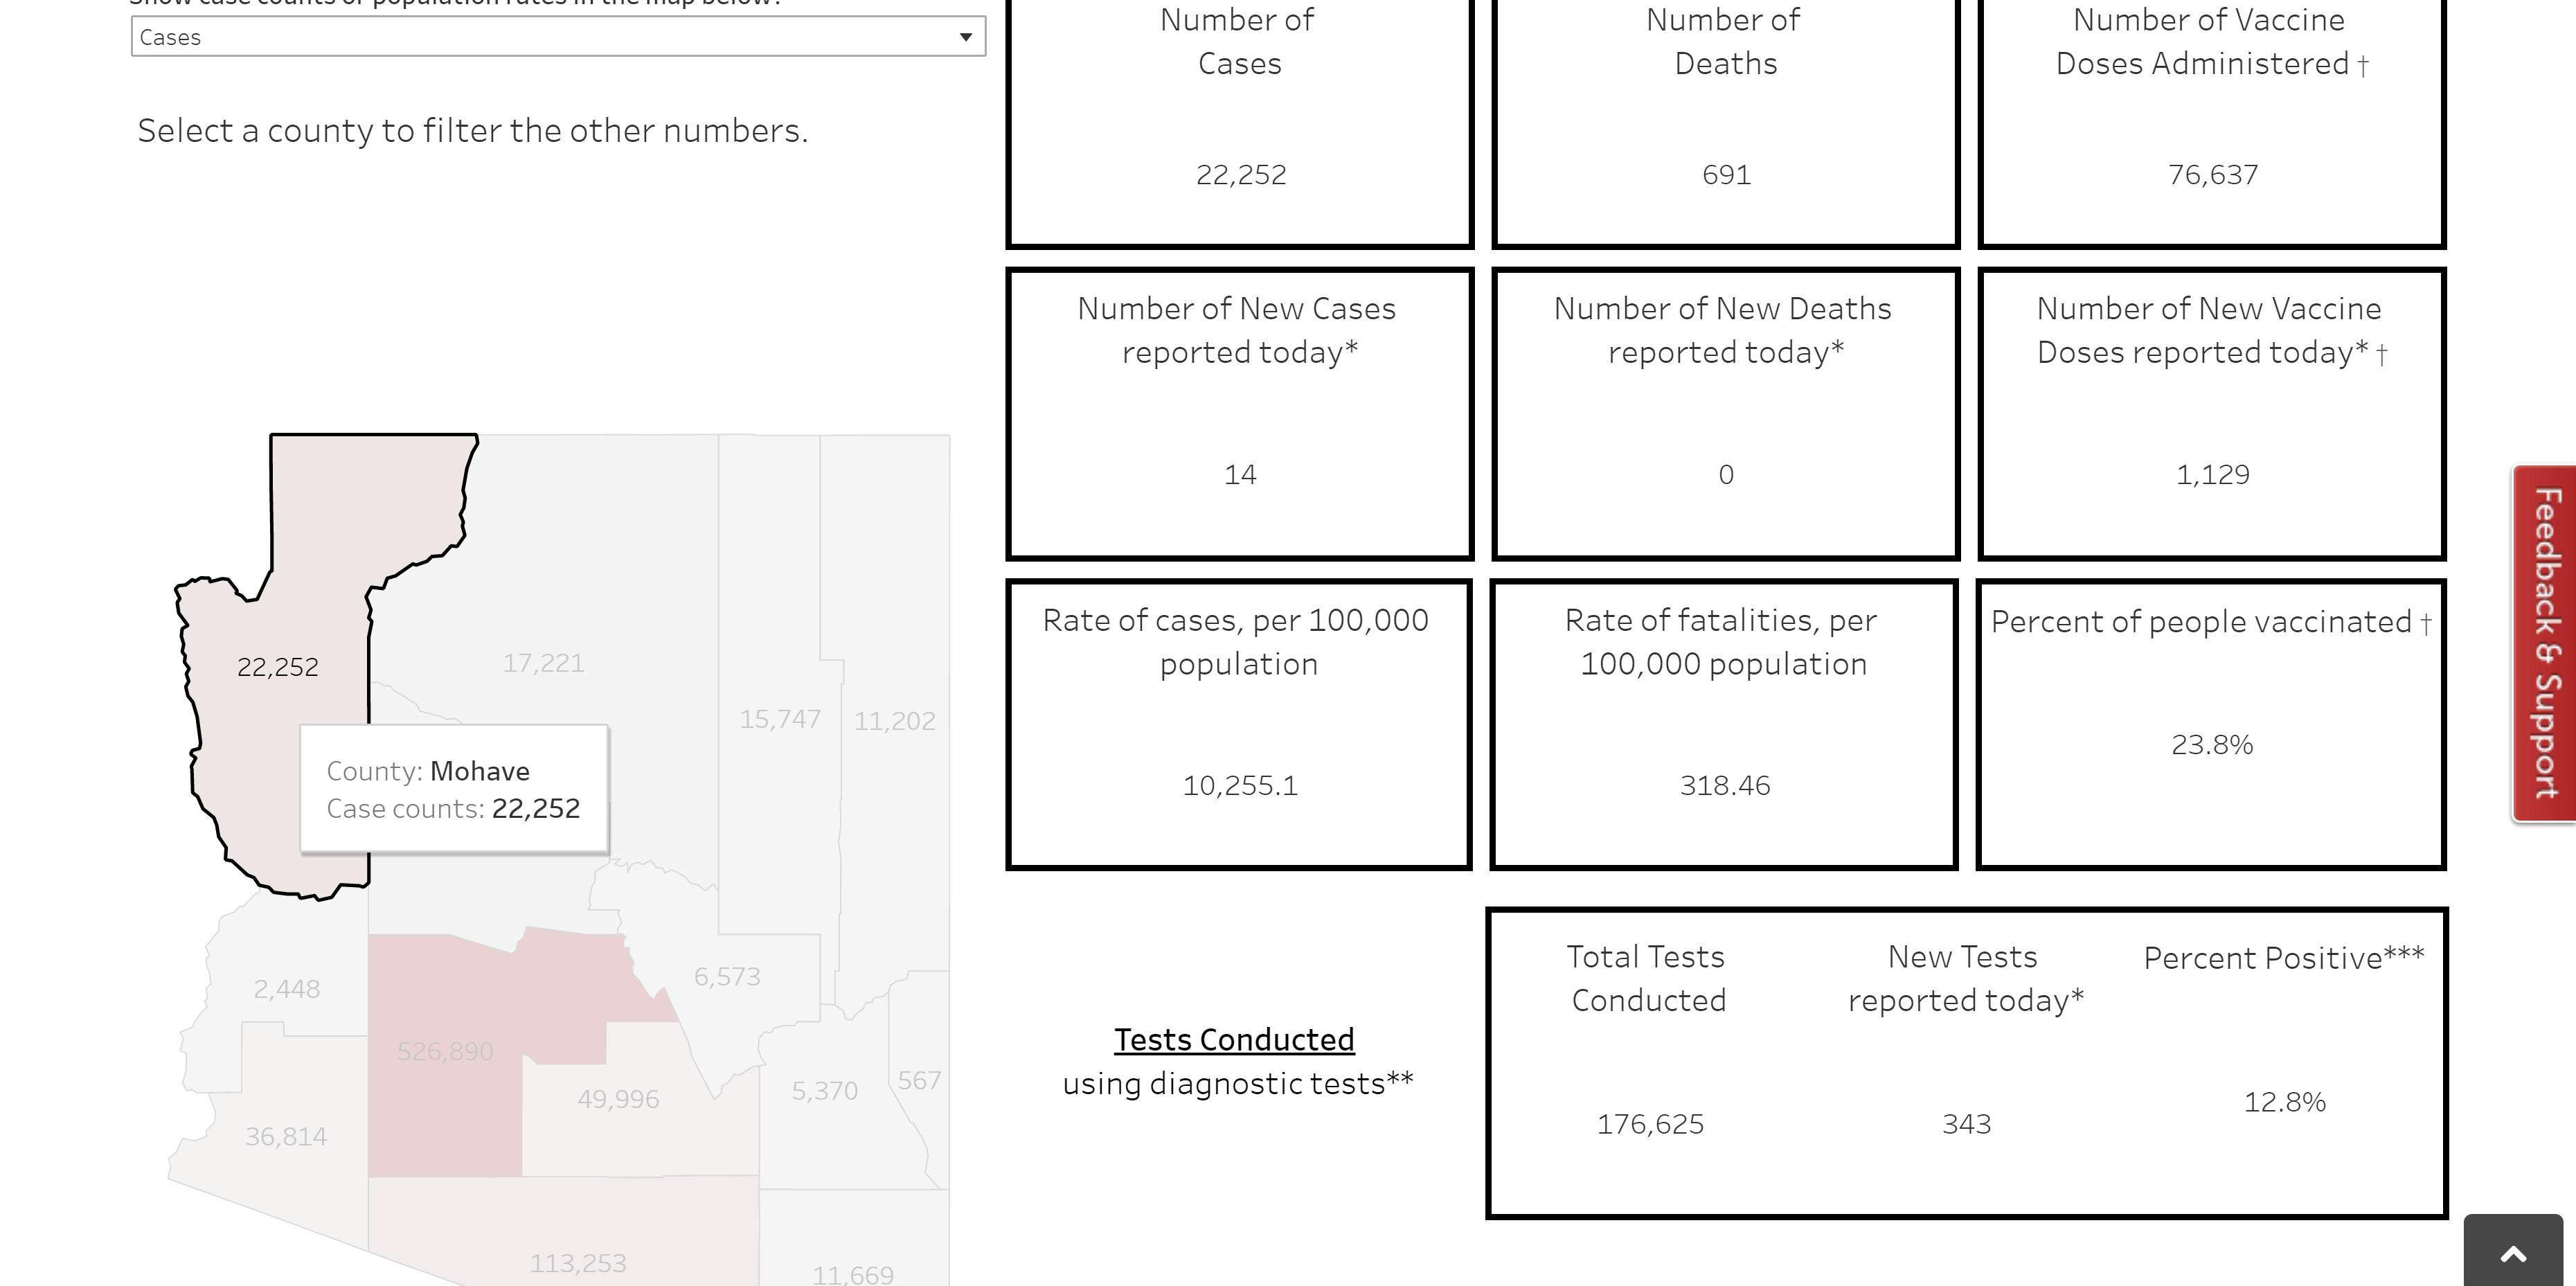
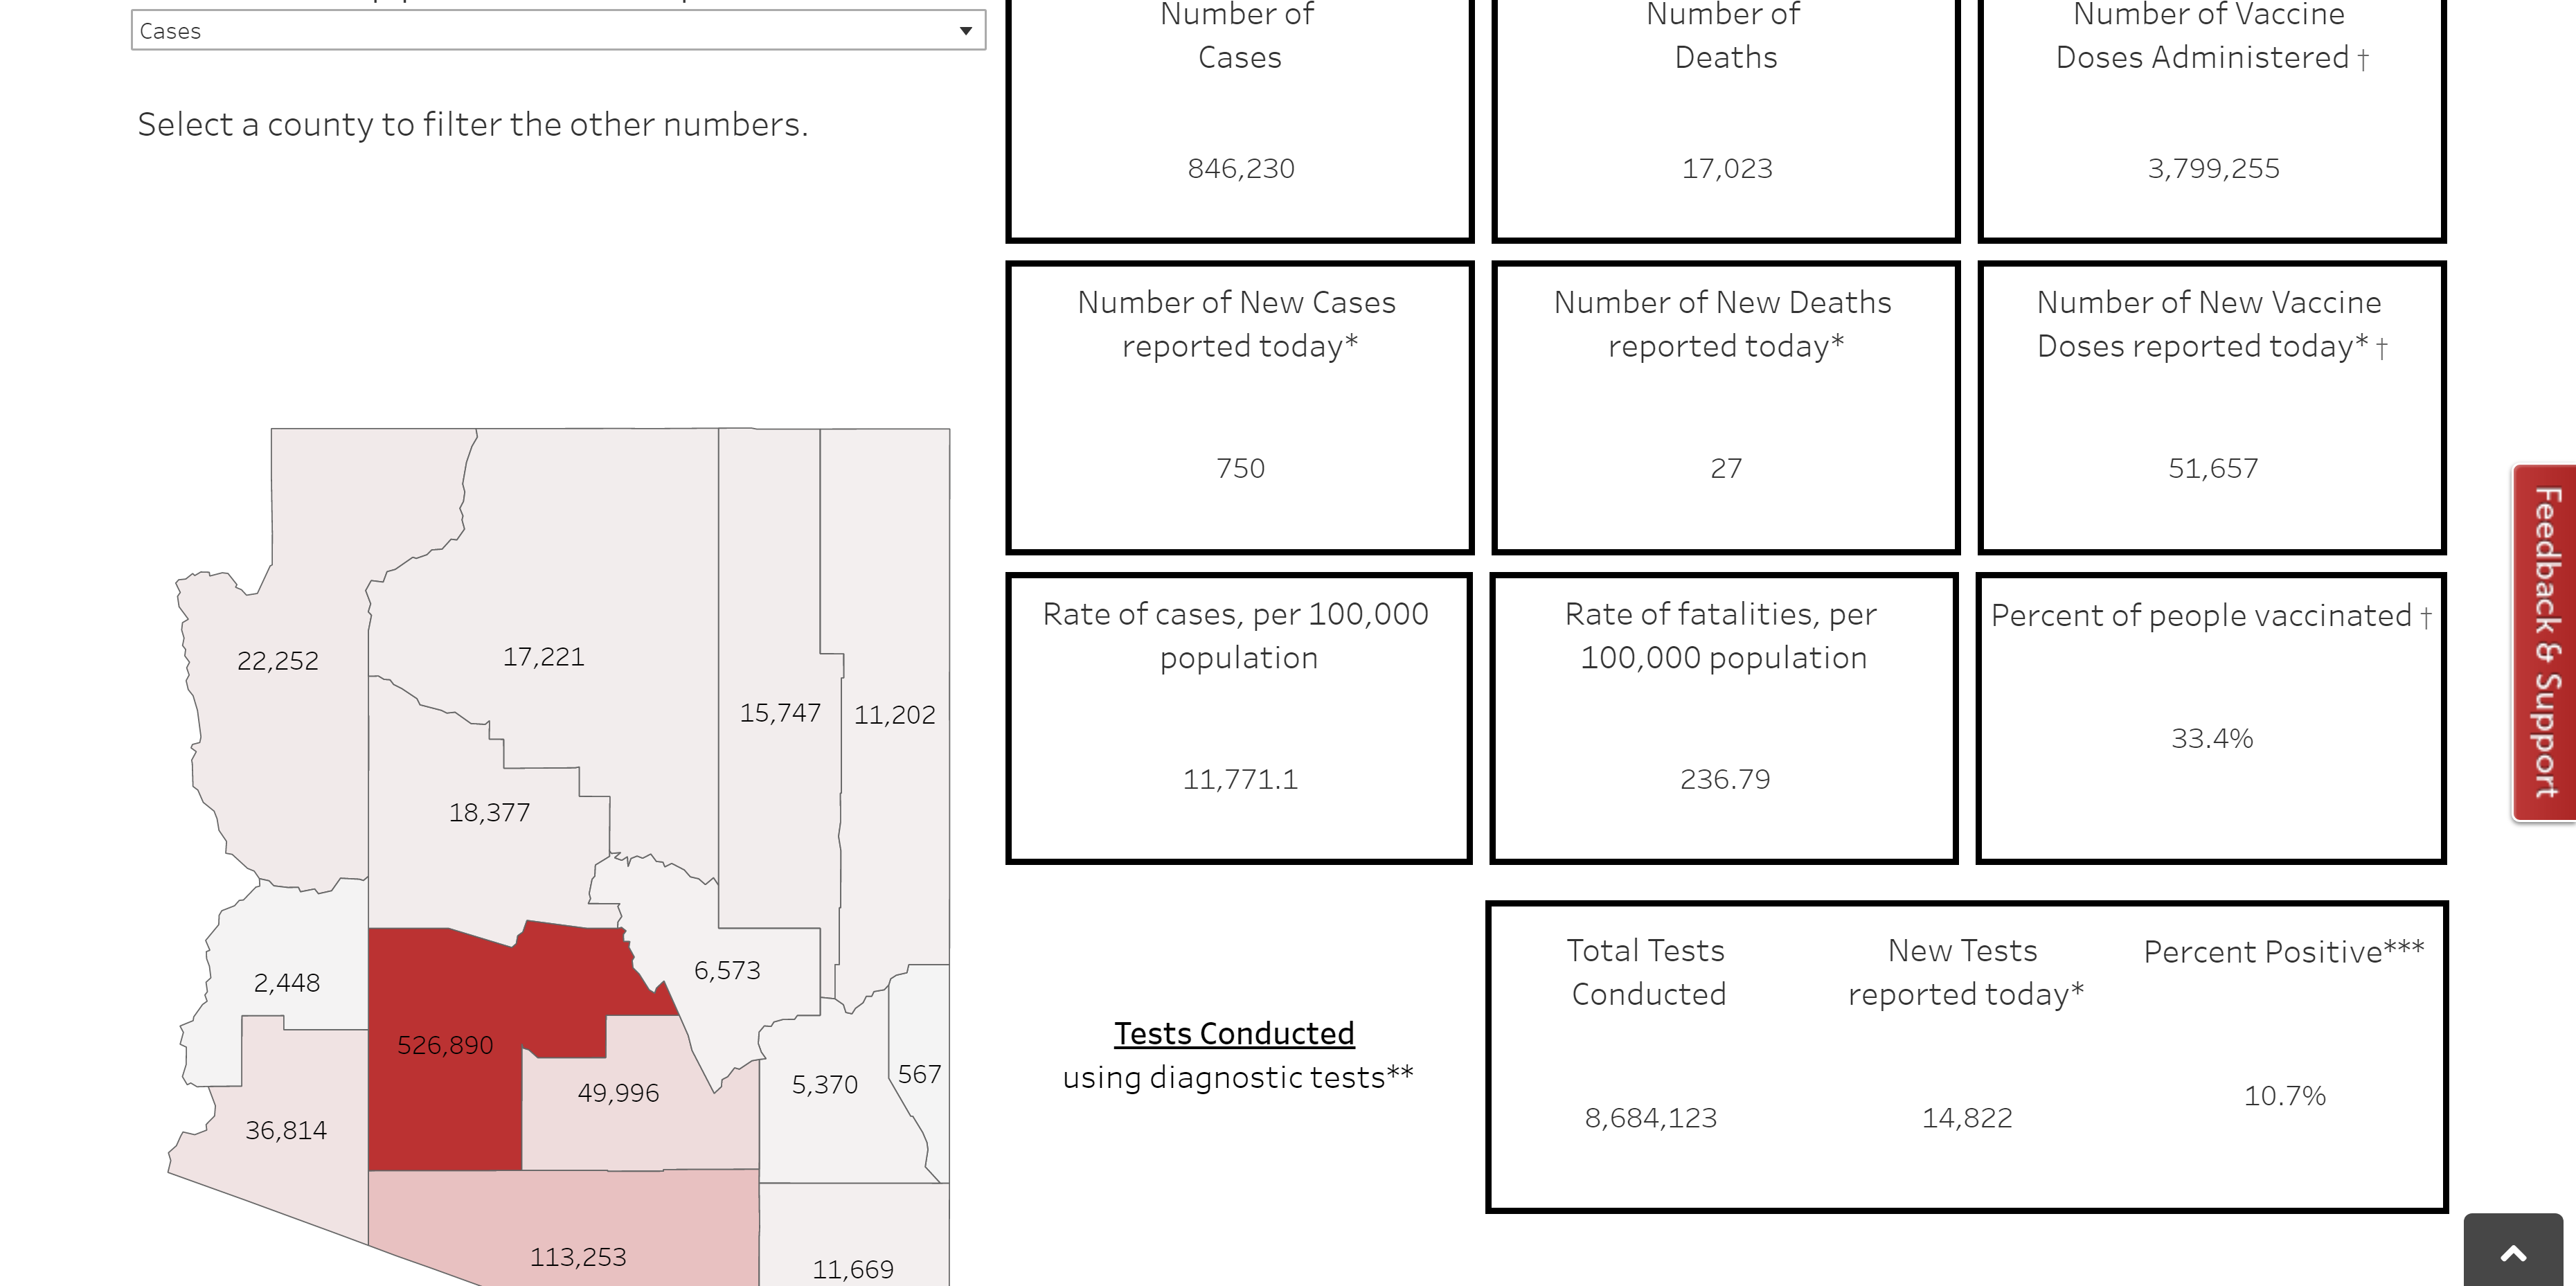
These screenshots show COVID-19 data from the Arizona Department of Health Services for each of Arizona's 15 counties and their cumulative state-wide total. The counties' respective case rate and death rate data are expressed as a percentage of their population and further demonstrate the dichotomies between pandemic experience by residential locale:
Arizona statewide: 11.77% population infection rate (0.236% population fatality rate)
Greenlee County: 5.47% (0.096%)
Yavapai County: 7.91% (0.210%)
Cochise County: 8.92% (0.214%)
Mohave County: 10.26% (0.318%)
Pima County: 10.84% (0.226%)
Pinal County: 10.93% (0.188%)
La Paz County: 11.08% (0.353%)
Coconino County: 11.69% (0.221%)
Gila County: 11.92% (0.402%)
Maricopa County: 12.06% (0.222%)
Graham County: 13.95% (0.200%)
Navajo County: 13.96% (0.462%)
Santa Cruz County: 14.77% (0.325%)
Apache County: 15.60% (0.586%)
Yuma County: 16.01% (0.357%)
Date (Dublin Core)
Creator (Dublin Core)
Contributor (Dublin Core)
Event Identifier (Dublin Core)
Partner (Dublin Core)
Type (Dublin Core)
Screenshots
Link (Bibliographic Ontology)
Controlled Vocabulary (Dublin Core)
Contributor's Tags (a true folksonomy) (Friend of a Friend)
Linked Data (Dublin Core)
Date Submitted (Dublin Core)
04/09/2021
Date Modified (Dublin Core)
04/18/2021
03/22/2022
08/02/2022
09/07/2024
Date Created (Dublin Core)
04/06/2021
This item was submitted on April 9, 2021 by James Rayroux using the form “Share Your Story” on the site “A Journal of the Plague Year”: http://www.covid-19archive.org/s/archive
Click here to view the collected data.